MOMOX3app guide

What everything means

A tour of the MomoX3 system — every signal, bubble, cloud, band, and pane, what it is, and what it's telling you. New here? Do the setup guide first so you're looking at live data.

The header Signals & the stack Clouds, bands & levels The options dock Tools & panes The Trading Journal Account & data
APP GUIDE · 2

Signals & the squeeze stack

The heart of MomoX3: a squeeze-fire engine that watches every timeframe at once and tells you when momentum ignites — and when the timeframes agree.

Signal bubbles on the chart and the squeeze stack pane below
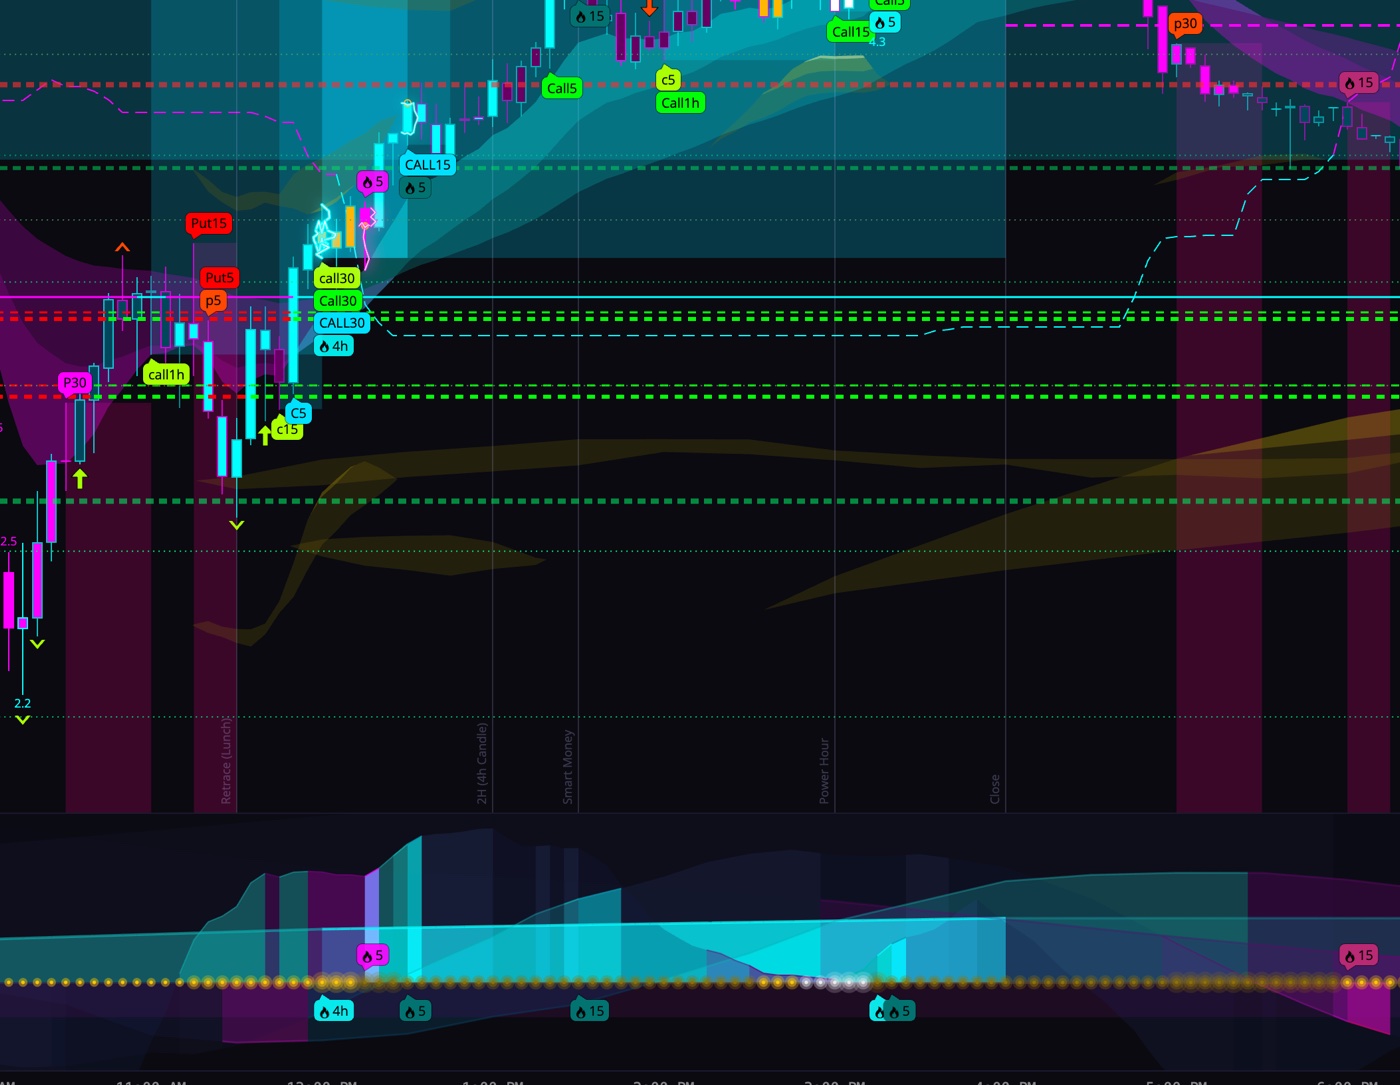
Signal bubbles Call1h · p30
A bubble prints on the chart when a timeframe's squeeze fires — compression releasing into a directional move. Green Call bubbles mark bullish fires, orange/red Put bubbles mark bearish ones, each labeled with its timeframe (5, 15, 30m, 1h, 2h, 4h, D). Several bubbles stacking near each other = multiple timeframes aligning, which is exactly the condition the system exists to catch.
Ghost (provisional) bubbles
A bubble drawn as bare colored text with no balloon is provisional — its bar hasn't closed yet, so the fire could still un-happen. It solidifies into a full bubble when the bar settles. There's a corner toggle in the signal popup if you'd rather not see provisionals at all.
Signal settings & animations
The signal popup also holds the fire animations — the glow around fired candles — with selectable styles (Aurora, Charge, Echo, Fireflies) and per-signal toggles (Fire, 4x8, 9x20, MACD). Animations run only for the current day's session, during market hours — a performance choice, so older fires show as plain bubbles. One symbol animating while another doesn't just means nothing fired today on the quiet one.
The squeeze stack
The compact rows near the bottom of the pane — one row per timeframe. Each dot shows that timeframe's squeeze state: compressing (energy building) or released/fired. Reading the stack top-to-bottom tells you instantly which timeframes are loaded and which already went. Click a row to spotlight it — the chart isolates that timeframe's story; click away to restore. The stack's corner buttons tune it: a timeframe menu for which histograms show, a fading-colors swap (dim hue previews where momentum is heading), and a squeeze highlight that makes active squeezes pop while the rest gray out.
EMA bias legend
The small cyan/magenta bubble column by the pane logo: each bubble is one timeframe's 9/21-EMA bias — cyan bullish, magenta bearish. A bubble split by a diagonal means the fast pair and the 50-EMA disagree (mixed tape). It's the fastest "who's in control per timeframe" read on the chart.
Momo wave
The oscillator pane below price: momentum thrust above/below the zero line, colored by direction. Waves growing = momentum expanding; waves shrinking back toward zero = the move exhausting.
Stochastic pane
An overbought/oversold pair (fast cyan, slow orange) with rails at 10 and 90 — the same math as the ThinkorSwim StochasX study, to the bar. When the fast line pins a rail while the squeeze stack is loading, you're watching a move coil at an extreme.
Reversal wedges OB/OS · REV
The chevrons above tops and below bottoms — the stochastic crossing back from overbought/oversold. The OB/OS button in the signal popup cycles four modes, and the default is REV: one wedge per overbought/oversold visit, placed at the visit's price extreme, so the chevron marks the turn instead of every rail cross. A doubled wedge ⏫ is the majors marker — the reversal came off a fresh session high/low, rejected the ichimoku span or a High-OI wall, or printed classic divergence (price pushed a new extreme while momentum didn't). The other clicks: OB/OS shows every regular-hours cross, OB/OS@Lvl only crosses that touch a level (pivots, moving averages, ichimoku, fib 50s, High-OI walls), then off. Per-pane, like the rest of the popup.
APP GUIDE · 3

Clouds, bands & levels

Everything painted on the price itself: where momentum lives, where options math says the day should stay, and where the big open interest sits.

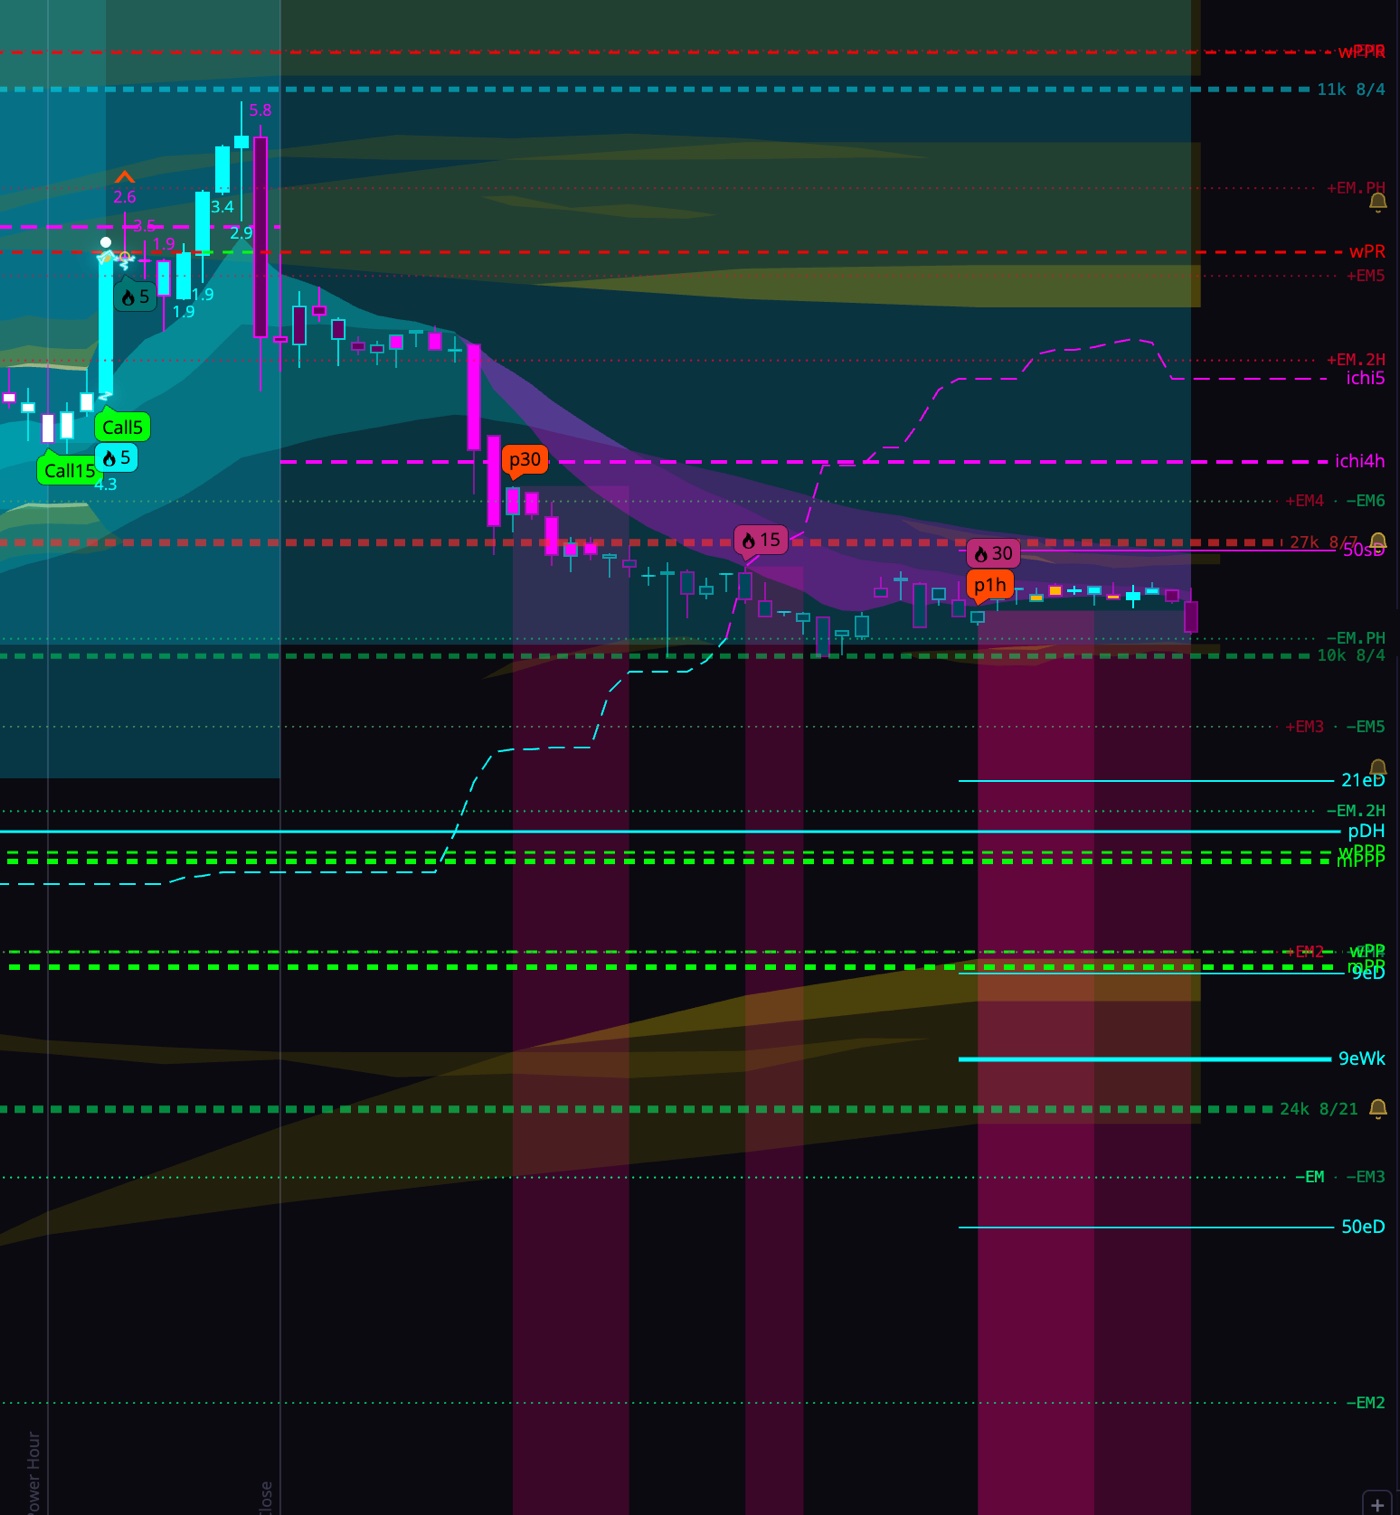
Momentum clouds, expected-move bands, and High-OI levels on the chart
Momentum clouds
The layered clouds behind price — one per timeframe, built from that timeframe's EMAs. Teal clouds are bullish, magenta bearish; higher-timeframe clouds are the wide slow-moving ones. Price riding above stacked teal clouds is trend; price chopping through mixed colors is not.
Ichi projection tails
The forward-projected cloud edges. Their color reflects the live close-versus-span relationship, so a tail only turns cyan when price has actually reclaimed the span — no premature flips.
Expected-move bands ±EM
The olive/yellow bands: the day's options-implied range, captured from the option chain at the open and then frozen — they're a fixed map for the session, not a repainting guess. Bands only draw when a real capture exists (no placeholders), and deeper EM rings dim at most gently so they stay readable. Price reaching a band edge is reaching what the options market priced as the day's move. As the day matures, fresh generations capture the live straddle — ±EM.2H at 1pm ET and ±EM.PH at 3pm ET — and a new generation swells briefly as it prints.
High-OI strike underlines
Horizontal underlines at the strikes carrying the largest open interest — the market's magnets. Cyan/magenta by side; an underline turns green only after price has tested it and bounced in a defended way (a real demand proof, not just a touch), and red for the supply-side equivalent. The lookback for those tests is adjustable in the dock.
Call / Put walls
The single biggest OI strikes each side, drawn as wall lines on the chart. Price often stalls, pins, or fights at a wall — knowing where they are is half the day's map. The ±EM toggle in the dock draws the expected-move lines alongside them.
Key levels (the lvl button)
Each chart's corner lvl button opens the levels engine — daily-derived reference lines drawn to the right edge with price tags (pDH, wPP, …). Every group has its own Fill control, and some ship at 0 so the chart starts clean — raise a group's Fill to reveal it: Prev H/L — previous day / week / month highs and lows (on by default). Prev O/C — previous day / week / month opens and closes, drawn dashed — including pDC, the previous day close (ships at Fill 0; raise it for gap days). Moving averages — EMA 9/21/50/200 and SMA 50/200 computed on daily, weekly, and monthly closes. Pivots — standard and Person's pivots, weekly and monthly, dashed. Levels ride every pane timeframe, and the right-edge tags can be toggled off — the lines stay either way.
APP GUIDE · 4

The options dock

The right-side dock turns the option chain into chart context.

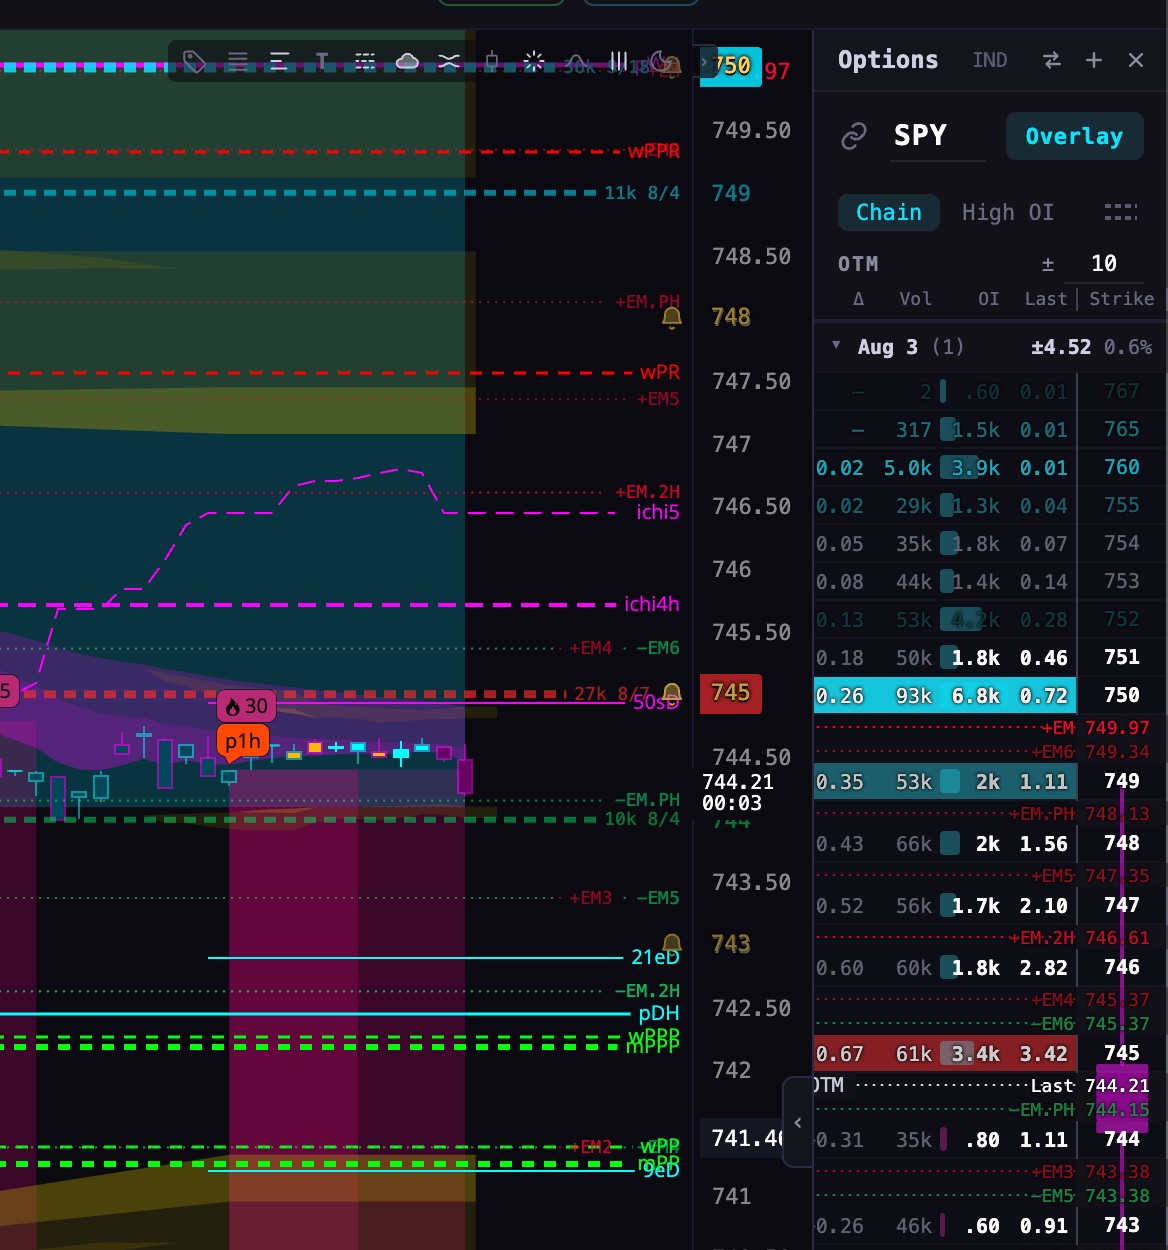
The options dock: chain view with calls and puts, High OI, and overlay controls
Chain
The live chain for the loaded symbol — calls and puts by strike with volume and open interest. The strikes-per-side control sets how much of the ladder you see (High-OI strikes always show).
High OI view
The chain reduced to what matters: the top open-interest strikes per side — the same levels that drive the chart's underlines and walls. One shared count controls both the view and the chart.
Overlay
Sends the dock's read onto the chart: High-OI underlines, walls, and the ±EM lines. Toggle each piece independently — chart context without leaving the tape.
In ±EM filter
A display filter on the High-OI view: show only the strikes inside the active expected-move band (plus one strike outside each edge). Pure display — the Top-# picks and their ranks never change. The active band follows the day: the open capture first, then ±EM.2H from 1pm ET and ±EM.PH from 3pm ET.
APP GUIDE · 5

Tools & panes

Drawing toolbar
Left rail: cursor, lines, rays, shapes, text, and glyph stamps. After you place a drawing the tool stays selected for rapid repeats and quietly returns to the cursor after a few idle seconds — Esc exits immediately. While a tool is held, hovering an existing drawing shows a grab cursor: clicking it selects and moves it instead of placing a new one.
Floating mini charts
The drag-a-box tool in the rail pops a full chart pane in a movable window — its own symbol, timeframe, signals, everything — floating above the layout. Click a window to raise it; drag to place it; closes. Cloning from a pane carries that pane's exact zoom so you keep your framing.
Price lock
The follow-the-tape toggle (left of the bars-ahead control): keeps your zoom while snapping the view to the newest bar at every close, horizontally and vertically. Set your zoom once, and the chart stays on the action.
Bars ahead
How much empty runway stays to the right of the newest candle — one global setting shared by every pane, and changing it keeps your zoom.
Candle-close countdown
The badge on the price axis counts down to the current bar's close, in the pane's own timeframe.
Display timezone
Tap the clock in the pane legend to pick your display timezone (US zones). Display only — every engine and session boundary stays on exchange time (ET).
Sub-studies +
The + at the pane's bottom-left manages the lower panes — volume, the squeeze stack, the oscillators — and studies, including session-anchored VWAP on intraday charts.
Workspaces
In the profile menu: save named workspaces — your layout, symbols, and settings as a set. Clicking a saved workspace opens it as its own window, exactly where it last was; New workspace… starts a fresh named window (a second monitor can hold a different setup); the deletes one (click twice to confirm). A named workspace saves itself into the list when its window closes — those rows show (last open) — and after a browser restart the app reopens every workspace automatically once you allow pop-ups for app.momox.io (one-time browser setting; otherwise a reopen banner offers them).
Pane splits
Drag the dividers between price, volume, the stack, and the oscillator panes to resize them — your sizes persist per pane across reloads.
Timeframe rows toggle
The small pills at the pane's bottom-left (5M 15M 30M 1H 2H 4H) show or hide everything belonging to a timeframe — its bubbles, cloud, and stack row — so you can declutter to just the frames you trade.
APP GUIDE · 6

The Trading Journal

Built-in trade journaling — because the members who improve fastest are the ones who log everything.

Trade Recap
Log a trade right from the chart — side, strike and expiry for options, entry, exit, size — and the recap self-fills what the chart already knows, so a log takes seconds, not minutes. Real and paper trades both count (marked apart), and futures log the same way.
Notes, tags & grades
Every recap takes free-form notes, your own custom tags, a letter grade, and a chart screenshot — the context that makes a journal worth re-reading.
Stats, calendar & goals
The journal rolls your entries into winrate, P/L (real and paper kept separate), a trading calendar, and weekly views. Set goals — portfolio size, target %, risk % — and the journal tracks you against them. Export everything as CSV any time.
Mentor notes
In the mentorship programs, your mentor reads your journal and leaves notes on specific trades — a cyan badge on the journal button means unread notes are waiting.
Share to Discord
Turn any recap into a share card and post it to the community recap channel in one click — your call whether the $ P/L rides along.
APP GUIDE · 7

Account & data

Profile menu
Top-left avatar: set your display name and picture, manage billing (update card, invoices, cancel), and grab your referral link — give $25, get $25: friends get $25 off their first month, you get a $25 credit when they subscribe.
Where your keys live
Alpaca and Schwab keys are stored only in your browser and attach only to your own data requests. Use a normal window — private/incognito windows forget keys when closed.
Schwab session
Schwab requires a fresh sign-in every 7 days — MomoX3 warns you a day early, and with ⚡ 1-click enabled the reconnect is two clicks: Connect Schwab → approve on Schwab's page, the rest finishes itself (guide). Between sign-ins it refreshes itself silently.
Devices & sessions
Your subscription covers up to 3 devices actively using the app — signing in on a 4th bumps the oldest. Academy-only sign-ins (reading /learn) never count against the 3. Schwab allows one live connection per app — MomoX3's cloud holds it for you and shares it, so all your devices stream Schwab at the same time; each device just does its own quick 7-day sign-in for its options chains + ±EM.
Making everything bigger
Use your browser zoomCmd/Ctrl + (or the browser menu → Zoom). The whole app scales together, and Chrome remembers the level per site, so set it once for app.momox.io and it sticks. Hi-res monitors also get an automatic boost on the small chart labels out of the box.
Install as an app
MomoX3 is a web app — use your browser's Install / Add to Home Screen and it opens in its own clean window with its own icon, on desktop and mobile alike. Same app, always current.
SAMPLE DATA
The demo tape shown before your keys are connected. Everything works — signals, clouds, dock — but the prices aren't live. Finish setup to go live.