Options Foundations by MomoX3
Nine short lessons in plain words for someone who has never placed an options trade. Read them in order, or jump to the one you need. Every picture is ours, every term is explained the first time it shows up, and every lesson ends at the same door: the free class, where the day's level is read live.
 AI CLARKintro · 15 s · coming
"I'm Clark. I've traded stock options for more than ten years, and this page is the thing I wish someone had handed me on day one."
"It is for you if you have never bought an option, or you have, and you still are not sure what you were holding. Nine lessons, plain words, pictures where they help."
"Read them in order. Then come to the free class and watch the day's level get read live."
An AI-made clip in Clark's own voice, labeled as such. Until it renders, the words are here.
The market
Before options make sense, the thing they are built on has to make sense: shares, the people trading them, and the few numbers that describe a whole market in one glance.
What the stock market is
A share is a small slice of ownership in a company. The stock market is where those slices change hands, all day, at a price that moves every time a buyer and a seller agree. In the United States the two big venues are the New York Stock Exchange and the Nasdaq, and the trading day runs from 9:30 AM ET to 4:00 PM ET, Monday to Friday, with a thinner session before and after.
Every quote you will ever see has three parts. The bid is the highest price someone is willing to pay right now. The ask is the lowest price someone is willing to sell for. The last is the price of the most recent trade. The gap between bid and ask is the spread, and a tight spread means a busy, liquid market where you can get in and out without giving much away.
Who is in it
You will hear four kinds of participants. Retail traders are individuals trading their own money, which is you. Institutions are funds, pensions and banks moving very large amounts, and their orders are what actually push prices around. Market makers stand ready to buy or sell at any moment and earn the spread for taking that risk. Hedgers hold a position somewhere else and trade here to protect it. None of them is your enemy. The point of learning the market is to notice which of them is active, because that is what the chart is showing you.
Indices and sectors
An index is a list of stocks rolled into one number so you can read the whole market at once. The S&P 500 tracks 500 large US companies. The Nasdaq 100 tracks 100 large companies, heavy on technology. The Dow tracks 30. You cannot buy an index directly, but you can buy a fund that mirrors one. SPY mirrors the S&P 500 and QQQ mirrors the Nasdaq 100, and because they trade like a single stock with enormous volume, they are where most day traders and most of this site live.
A sector is a group of companies in the same line of business: technology, energy, financials, health care, and so on. Money rotates between sectors as the mood changes, and a day when energy is green and technology is red tells you something the index number alone does not.
Volatility
Volatility is how much and how fast prices move. On a calm day SPY drifts a few points and the candles are small. On a volatile day it swings several times that, the candles are tall, and the moves come faster than you can think. Volatility rises when people are uncertain or scared, usually around news, and it falls when the news is out and the market settles.
The market keeps a live reading of expected volatility called the VIX, often called the fear gauge. You do not need to trade it. You need to glance at it, because the same setup that works on a calm day can stop you out in seconds on a wild one, and option prices themselves get more expensive when the VIX is high. You will meet that idea again under vega in lesson 3.
Options
An option is a contract about a stock, not the stock itself. Once the four words on the contract make sense, everything else in options is a variation on them.
What a contract is
An option gives its owner the right, but never the obligation, to buy or sell 100 shares of a stock at a fixed price, up to a fixed date. You pay for that right up front. If the stock goes where you hoped, the right becomes valuable and you sell it on. If it does not, the most you can lose as a buyer is what you paid.
Because one contract covers 100 shares, a tiny move in the stock becomes a large move in the option. That leverage is why people trade options, and why beginners get hurt by them. Both come from the same place.
Calls and puts
A call is the right to buy. You buy a call when you think the stock will go up. A put is the right to sell. You buy a put when you think the stock will go down. That is the whole split. Everything that sounds complicated later is just calls and puts combined.
Buying versus selling
When you buy an option you pay the premium, you own the right, and your risk is capped at what you paid. When you sell an option you collect the premium, you take on the obligation, and your risk can be much larger than what you collected. New traders should start on the buying side. Selling has its place, and lesson 7 shows the one selling structure a beginner can understand, the credit spread, but it comes after the basics, never before.
How to place an order
Most of our members trade through Schwab, and the ticket looks the same in any broker. You choose the stock, open its options chain, the list of every strike and expiry, and pick the side (call or put), the expiry, and the strike. Then the order itself:
- Action: buy to open. (Closing later is sell to close.)
- Quantity: how many contracts. Start with one.
- Order type: a limit order names the most you will pay and waits for it. A market order takes whatever the ask is right now. Use limits. Options spreads can be wide, and a market order pays the whole width.
- Review and send. Read the whole line back before you click: side, strike, expiry, quantity, price. Most beginner disasters are a wrong line, not a wrong idea.
The Greeks
An option's price moves for more than one reason. The Greeks are five numbers that each name one reason. You do not need the math. You need one sentence and one picture per letter.
Delta
Delta is how much the option moves when the stock moves one dollar. A call with a delta of 0.5 gains about half a dollar per share, 50 dollars per contract, when the stock rises a dollar. Delta runs from 0 to 1 for calls and 0 to minus 1 for puts. At the money it sits near 0.5; deep in the money it approaches 1 and the option behaves like the stock; far out of the money it approaches 0 and the option barely reacts. Delta is also a rough read of the odds the option finishes in the money.
Theta
Theta is how much the option loses each day just from time passing. Every option is a bet with a deadline, and the closer the deadline, the faster the time value drains. Theta is small with weeks to go and brutal in the last days. This is the number that beats beginners who are right about direction and still lose: the stock went their way, but too slowly.
Gamma
Gamma is how fast delta itself changes. It is largest at the money and near expiry, which is exactly where same-day SPY options live. High gamma means a small move in the stock swings the option hard in both directions. It is the reason a cheap contract can double in minutes, and the reason it can halve just as fast.
Vega
Vega is how much the option moves when expected volatility changes. When fear rises, every option gets more expensive even if the stock has not moved. When the news is out and fear drains, premiums deflate. Buying options right before a big announcement often means paying a high vega price that collapses the moment the announcement lands.
Rho
Rho is how much the option moves when interest rates change by one percent. For a day trader it is close to nothing. You will see it on the chain; you can ignore it for years.
Reading the chart
A chart is the market's memory drawn as a picture. Price action is reading that picture without any indicator at all. Indicators come second, and there are only four a beginner needs to recognise.
The candle
Each candle is one slice of time, five minutes on a 5-minute chart, one day on a daily. The thick body runs from where price opened to where it closed. The thin wicks reach to the highest and lowest price in that slice. A candle that closed above its open is drawn in one colour, below its open in another. Long wicks mean price went somewhere and was pushed back; a long body means it went somewhere and stayed.
Price action
Support is a price where buyers have shown up before, so a falling market tends to slow or bounce there. Resistance is the opposite: a price where sellers have shown up before, so a rising market tends to stall. These are not magic lines. They are places where a lot of people remember what happened last time, and act on it.
A trendline connects a series of higher lows (an uptrend) or lower highs (a downtrend). Two parallel trendlines make a channel, and price bouncing between them is one of the cleanest things a beginner can learn to see. When price keeps going the way it was going after a pause, that is continuation. When it turns, that is a reversal. When it goes nowhere and the candles shrink, that is consolidation, and consolidation usually ends in a fast move, because everyone waiting finally gets a reason.
Momentum is the speed of a move. Tall candles in one direction with small wicks are momentum. It is what you want behind you and what you do not want to fight.
The four indicators worth knowing
Where MomoX3 comes in
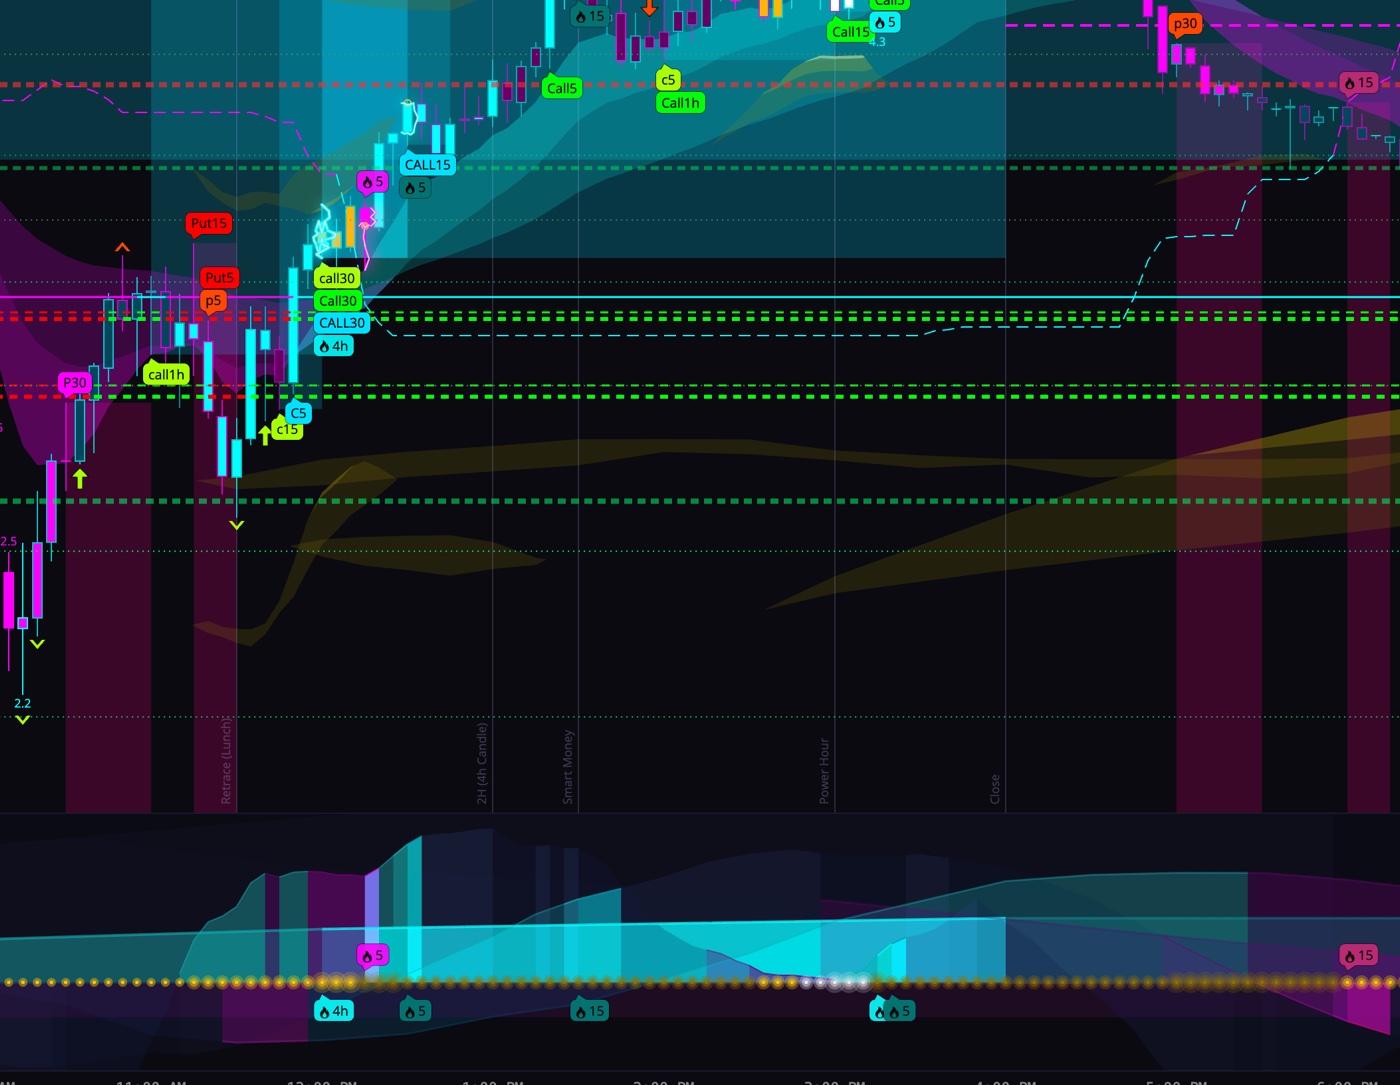
Everything above is what a trader draws by hand, every morning, for years, until it is automatic. MomoX3 is the chart that does the drawing for you: it marks the day's level before the open from where the options market is heaviest, it watches the moving averages and the squeeze on every timeframe at once, and when the pieces line up it prints a bubble on the candle instead of asking you to notice. The level comes first, the bubble is the trigger. Learning the chart by hand first is still the point of this lesson, because a bubble you do not understand is a bubble you cannot trust.
Fundamentals
The chart shows what traders did. Fundamentals are why. A day trader does not study balance sheets, but a day trader must know what is on the calendar, because the calendar is what makes a quiet chart explode.
Earnings
Four times a year every public company reports its results, and the stock often moves more in the minutes after than in the weeks before. Reports land before the open or after the close, almost never during the session. Two rules for a beginner: know whether a stock you are trading reports this week, and do not hold a same-week option through its report unless that was the plan from the start. The vega lesson applies in full: premiums are inflated going in and collapse coming out.
Economic data
The government and the Federal Reserve publish numbers on a schedule, and a handful of them move the whole market: the monthly jobs report, the inflation readings, and the Fed's rate decision with its press conference. Most land at 8:30 AM ET, an hour before the open, so the first candles of the day already carry the reaction. The Fed decision lands at 2:00 PM ET and the half hour after is the wildest of the month. You do not need to predict these numbers. You need to know the time they land and either be flat or be sized for it.
News and catalysts
A catalyst is any event with a time attached that can move a price: a report, a decision, a product launch, an analyst upgrade or downgrade, a headline nobody saw coming. Scheduled catalysts you plan around. Unscheduled ones you react to, and the first reaction is usually to tighten up, not to chase.
How we use it: the morning brief
Inside MomoX3 the morning starts with a brief: today's scheduled catalysts, the names reporting, the data landing and when, and a read on which of the day's levels those events sit near. That is fundamentals the way a day trader needs them, as a short list with times on it, not as research. By the time the open comes, the plan already knows where the day can get loud.
Kinds of trading
The only real difference between the styles is how long you hold. That one choice decides which chart you watch, which expiry you buy, and which rules your broker applies to you.
| Style | Hold | Chart | What it needs from you |
|---|---|---|---|
| Scalp | seconds to minutes | 1-minute, 5-minute | Full attention, fast hands, a tight stop. Many small trades. Hardest on the nerves. |
| Day | minutes to hours, flat by the close | 5-minute with the 15-minute and hourly behind it | A level, a trigger, a plan for the day. No overnight risk. Where MomoX3 charts live. |
| Swing | days to weeks | hourly, 4-hour, daily | Patience, wider stops, an expiry weeks out so theta is gentle. Where a scanner earns its keep. |
| Position | weeks to months | daily, weekly | A thesis more than a chart. Options here are usually months out or replaced by shares. |
Pick one. Beginners lose by being a day trader at 10:00 AM ET and a swing trader at 3:55 PM ET because the trade did not work. The hold time is decided before the entry, not after.
The pattern day trader rule
In the United States a day trade is opening and closing the same position in the same session. In a margin account below 25,000 dollars, the rules allow only three day trades in any five trading days; a fourth flags you as a pattern day trader and the broker restricts the account until it is back above the line. In a cash account the rule does not apply, but you can only spend money that has settled, and option sales settle the next business day. Many beginners start in a cash account for exactly this reason: the limit becomes "what is settled", not a count of trades.
Strategies
Three structures cover a beginner's first year. Two of them you already know from lesson 2. The third is the first one that involves selling, and it is worth understanding even if you never trade it, because it explains what the other side of your trade is doing.
The long call
You buy a call because you expect the stock to rise before expiry. Your most is the premium. Your plan has three numbers before you enter: the level you are buying at, the level you are selling at, and the level that proves you wrong. On SPY a day trader usually picks a strike at or just out of the money with today's or this week's expiry, and gets out at the next level, not at a feeling.
The long put
The mirror: you buy a put because you expect the stock to fall. Same three numbers, same cap on the loss. Puts also work as insurance on something you own, which is the hedging idea in lesson 8.
The credit spread
A credit spread is two options at once: you sell one and buy another further out of the money, same side, same expiry. You collect more for the one you sold than you paid for the one you bought, so money comes in on day one; that is the credit. The one you bought caps your loss at the distance between the two strikes minus the credit. You win if the stock stays on your side of the sold strike through expiry.
Why a beginner should know it: a credit spread is a bet that something will not happen, and theta works for you instead of against you. Why a beginner should not start with it: the maths is backwards from buying (small gains often, a larger loss sometimes), and getting the close wrong near expiry is how small accounts take a big hit. Learn it, paper trade it, come back to it after the basics are automatic.
Risk
Nothing on this page matters if the account does not survive the learning. Risk management is four habits, and all four are decided before the trade, not during it.
Position size
Decide how much of the account one trade may cost you, and keep it small: a few percent of the account at most, the same amount every time. The point of a fixed size is not the maths. It is that a loss stays a normal event instead of a crisis, so the next decision is made by a calm person. Very small accounts cannot get a single contract under that line, which is a sign to paper trade first or to trade less expensive names until the account grows.
Number of positions
Two or three at a time is plenty. Beyond that a beginner stops managing trades and starts watching a list. If you cannot say the exit plan for every open position from memory, you have too many.
Hedging
A hedge is a second position that gains when the first one loses. Owning shares and buying a put against them is the classic one: the put is insurance, you pay a premium, and if the stock falls the put pays. For a day trader the honest version of hedging is simpler: a smaller size, a hard stop, and no trade at all when the picture is unclear. Being flat is a position. It is the only one that never loses.
The indices as the barometer
Before any trade in any stock, look at SPY and QQQ. A stock fighting the index is swimming upstream, and most of the time the river wins. When the index is at a level and turning, the stocks that follow it turn too. That is the reason every lesson here ends at one SPY level: learn the barometer first, and everything else gets easier to read.
Psychology
The first 90 days follow a curve almost everyone rides: a lucky start, a humbling, and then, for the ones who keep a journal, the slow climb. Three coaches we study have one rule each for that climb.
The first 90 days
Most new traders get a few early wins and feel ready. Then the market changes character, the same moves stop working, and the account gives back the wins and more. That dip is not a sign you are bad at this. It is the moment confidence catches up with competence, and the only people who never feel it are the ones who quit before it arrives. Expect it, size small enough to survive it, and write every trade down, because the journal is how the climb out of the dip actually happens.
One rule from each coach
- Jared Tendler: the problem is a belief under the emotion, not the emotion. When you feel the urge to add to a loser or chase a move, name the belief ("I can't end the day red") and fix that, off-hours, on paper.
- Brett Steenbarger: write the plan before the open, with the exit decided, so the trade is executed when its conditions are met and never re-argued at the level. A well-planned loss is information, not a failure.
- Annie Duke: grade the decision, not the result. A good trade can lose and a bad trade can win; the journal has two columns, and only the decision column is yours to improve.
The habit that makes all three work: a few quiet minutes before the open to write the plan, and a few after the close to grade it. Twenty-five minutes a day. Nobody learns a new routine inside a losing trade, so build it on the good days.
Want this as five short emails?
One a morning for five days, each one a two-lesson summary with the link back to the section. Nothing to buy. They stop by themselves after the fifth.
AI CLARKhand-off · 15 s · coming"That is the foundation. You know what a contract is, what moves its price, how to read the chart it lives on, and how to keep the account alive while you learn."
"What you have not seen yet is a level being read on a live day. That is the free class: every other Wednesday, 8:00 PM ET, on Discord. Bring the questions this page gave you."
An AI-made clip in Clark's own voice, labeled as such. Until it renders, the words are here.